2018 Spring Air Travel Forecast
Who doesn’t want a change of pace after the monotonous months of winter? Like clockwork and bears, wanderlust awakens in us at the very first signs of oncoming spring, and there are fortunately many vernal holidays for those of us who are not students and need a halfway decent pretext or excuse. Unlike clockwork and rather more like bears, the spring travel season can be quite unpredictable, especially as compared to travel during the weeks before and after Thanksgiving and Christmas.
In the spring, everyone is doing their own thing: spring break occurs at different times at different schools, and at different times each year. Passover and Easter are observed at different times every year, up to a month apart (in 2016, more than a month’s time separated Easter Sunday and the end of Passover), and Memorial Day weekend wanders around the end of May.
RewardExpert analyzed five years’ worth of data for every day from March 1st through May 31st, to forecast delays and crowds for each day. Airport and airline performance was achieved by aggregating airport/airline on-time performance data for each month and the three month period overall.
Best and Worst Dates for Spring Travel
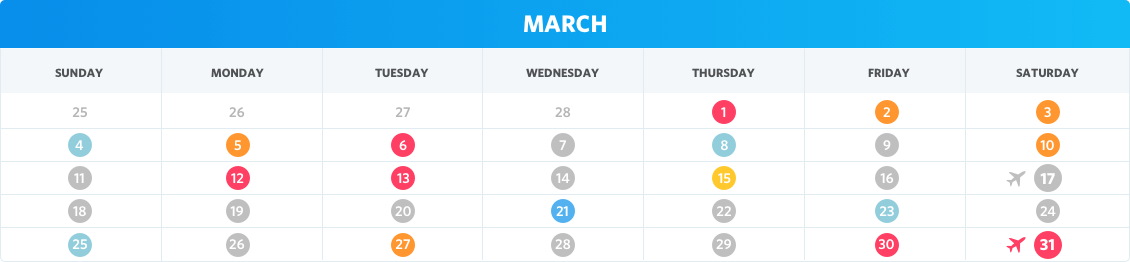

Note: Holidays marked with plane icon
- March is by far the most treacherous month for spring travel. Six of the ten days with the worst average on-time performance, busiest airports and most crowded flights, fall at some point during the month. And what’s more, delays have increased significantly over the last five years, by as much as 11.6%. Avoid flying on March 1st, 12th or 13th, which are historically among the worst days for travel this season, and are expected to be worse this year.
- If you’re planning to visit family for Easter or Passover, travel early if you can. Easter Sunday and the first day of Passover, as well as the day before, are more likely than most to feature delays and airport hassles.
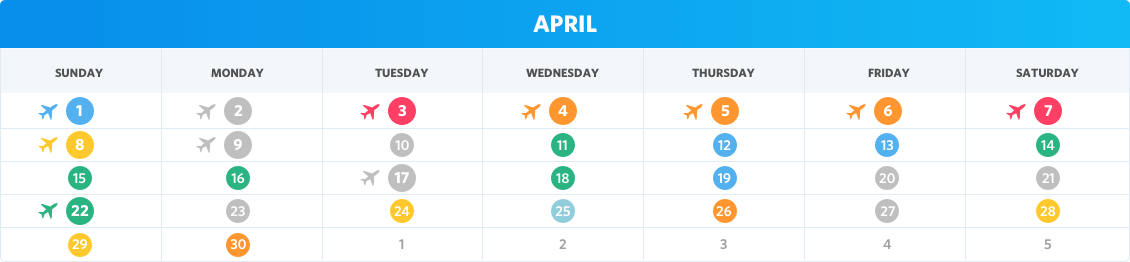
- April is NOT the cruelest month. Only the first week of it is, which has seen some of the steepest declines in average on-time performance over the past five years. Flight delays on April 6th have increased by over 25% (but are mitigated by relatively low air traffic volume), while average on-time performance on April 7th has declined by 14.63%. But if you can wait it out, April can be quite kind to you.
- Tax Day has been delayed once again this year, but you’re unlikely to be. Reward yourself for getting that tax return in at the last minute with a trip that will let you unwind even before you arrive. Flights between April 11th and 18th are among the least frequently delayed, airports are not especially busy, and already high on-time performance for flights on these days has been increasing consistently over the last five years.
- Earth Day is yet another favorable day for your travel plans, with a great - and improving - on-time performance record, with an average of 85.11% of flights departing or arriving on-time.
- Flights on or in the days before Memorial Day are unexpectedly good options. While average on-time performance is not exceptionally high, airport flight volume and presumable passenger ridership are unusually low around this time. While your flight may wind up delayed, you’ll likely have fewer airport hassles and be stuck on a less crowded plane.
- The worst days of the season coincide with the beginning of Daylight Savings Time. While it would be a complex proposition to demonstrate conclusively, it is highly likely that fiddling with our clocks would affect more than our circadian rhythms!
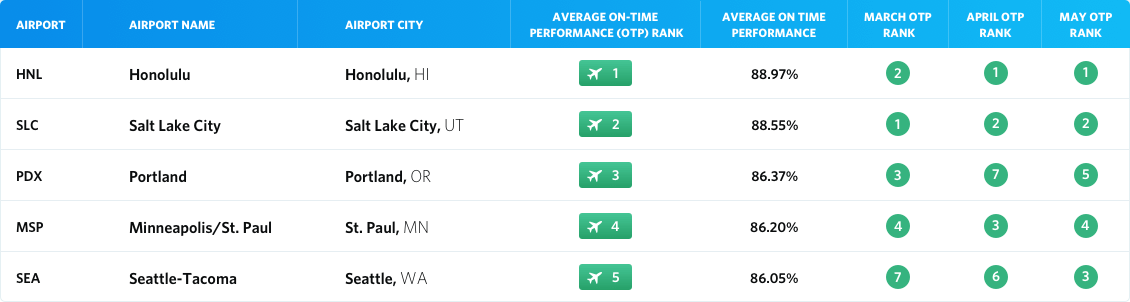
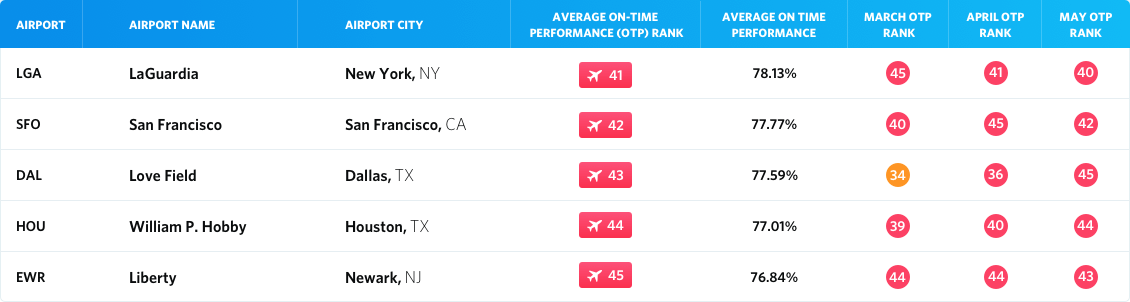
Best and Worst Airports
- Newark’s Liberty International Airport has the worst overall track record for delayed flights, with an average of only 76.84% of flights departing or arriving on-time. Likely suspects, San Francisco, LaGuardia, JFK, and Chicago’s O’Hare and Midway airports all return to grace the bottom tier of our ranking.
- Texas-bound travelers should brace themselves for delays. Houston’s William P. Hobby Airport and Dallas’ Love Field take second and third place for most delayed flights during springtime, with on-time performance getting worse as summer approaches. Love Field starts out ranked 34th in March, falling to last place by May, with Hobby doing little better, starting at 34th and falling to 44th. George Bush Airport is a much better alternative for flights to and from Houston. Consider flying into Fort Worth instead of Dallas; even though delays are still quite frequent, you’re more likely to be on-time, especially in May.
- Spring break wreaks havoc on flights to and from Florida during March and April. Expect delayed flights and planes full of college students at all major Florida airports. Southwest Florida Airport in Fort Myers is the least busy airport in May, but handles nearly twice as many flights per day in March than it does in May: 3,959 as compared to 2,098. Accordingly, flight delays are much more frequently encountered here during the month of March. Southwest Florida ranks 24th for on-time performance during this time, but by May it ranks 7th.
- Orlando is bad, but Fort Lauderdale Airport is worse during Spring Break. During March and April, flights to and from Fort Lauderdale are so likely to be delayed that it comes close to taking last place for average on-time performance, ahead of only Newark Liberty International Airport and LaGuardia in March. Miami is a much better option for travel to and from South Florida during March and April, but not at other times of the year.
- Honolulu and Salt Lake City retain their titles as the airports with the fewest delayed flights. Only about one in ten flights arriving or departing either Honolulu or Salt Lake City experience delays of more than 15 minutes (88.97% and 88.55% on-time). Portland, Oregon, Minneapolis-St. Paul, and SeaTac are not far behind, all with on-time performance averages slightly above 86%.
- Atlanta’s Hartsfield-Jackson Airport continues to boast an impressively high average on-time performance, and remains the busiest air travel hub in the nation. Travelers with connecting flights in Atlanta should not be overly concerned with a delayed flight resulting in a missed connection.
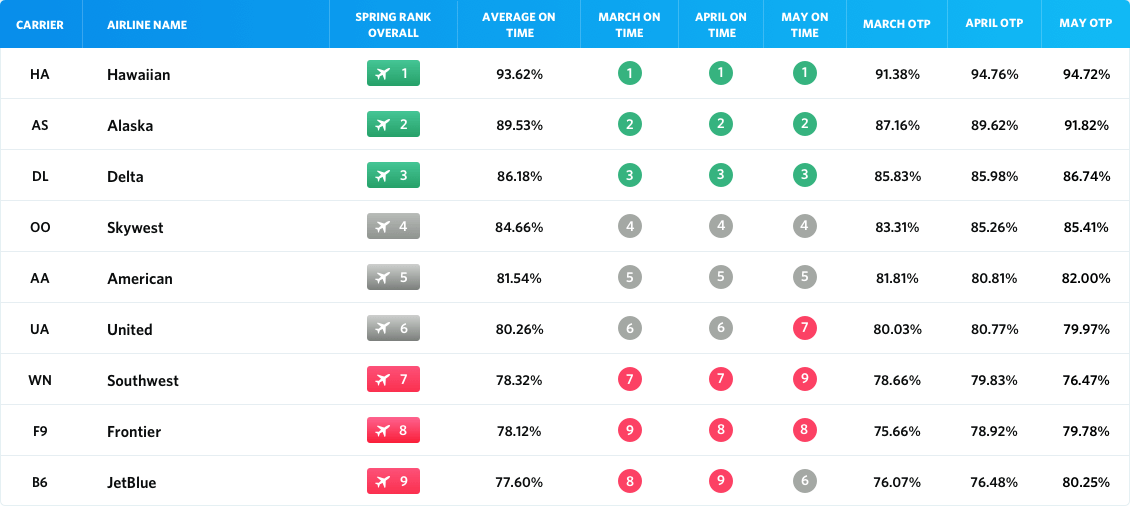
Best and Worst Airlines
- Hawaiian Airlines remains the airline with the best track record. With an average of 93.62% of flights arriving and/or departing on time, Hawaiian’s performance exceeds second place Alaska Airlines by 4.09%, and trounces number three, Delta, whose 86.18% on-time performance is the best of the major national carriers.
- JetBlue has the worst on-time performance overall, coming in dead last, and appears to bear the brunt of the onslaught of Spring break travelers. The other budget carriers, Southwest and Frontier, unsurprisingly take second and third place for most delayed flights overall. However, Frontier’s March-April average on-time performance is not much lower than average, whereas Southwest has fewer delays in March and April. JetBlue, on the other hand, takes sixth place in May, at 80.25% on-time.
- The major national carriers perform consistently throughout the spring. Delta earns third place nationally and leads the pack among competing national carriers, American and United, which fall in the middle of the pack earning fifth and sixth place, respectively.
Time to Take Advantage of Some Benefits
Many credit cards today offer a variety of travel benefits that few of us ever use or even realize we have. If you have found yourself delayed because of the high volume of travelers during this time of the year, check your wallet and find out if you can cash in on travel rewards.
Complimentary Lounge Access
Many cards, such as the Amex Delta Reserve card, Citi AA Executive card, and the Chase United Club card offer complimentary lounge access. This can make your longer than expected time at the airport much more comfortable.
Concierge Services
It is frustrating to face unexpected delays when travelling. That’s why utilizing any free concierge services you may have available can be a good idea. Cards like the Capital One VentureOne Rewards card or the Citi ThankYou Premier Card can both offer 24 hour complimentary concierge services.
Insurance for trip delay or cancellation
Chase has a nice assortment of cards that will cover up to $500 per day for expenses related to your trip being delayed. The Sapphire Preferred, Sapphire Reserve, Ink Plus, and United MileagePlus cards offer this $500 allowance for each traveler, as long as you purchased the tickets using your Chase account.
Citi also offers trip delay insurance when you use your Citi AAdvantage Card, Citi AAdvantage Executive, Citi HHonors Reserve and Citi ThankYou Prestige cards.
Lost/Delayed Luggage
Most American Express cards include complimentary lost or delayed luggage insurance. The Premier Rewards Gold card and the Delta Reserve card are just two examples.
Most of these travel benefits have restrictions and special conditions that apply, but they are well worth it when you need them. Be sure to take a look at what travel benefits your cards carry before you leave for your next trip.
Methodology
RewardExpert analyzed on-time performance data provided by the U.S. Department of Transportation Bureau of Transportation Statistics for the months of March, April, and May. We calculated the average on-time performance figures for each date over the last five years, as well as average flight volume. We likewise calculated five-year average on-time and flight volume figures for each month at the 45 busiest airports in the U.S. and for each major airline.
On-time performance was calculated on a daily basis for both departing and arriving flights, as a proportion of the total number of flights on each day. We then combined on-time arrivals and on-time departures to obtain overall on-time performance, and then calculated the average flight volume and on-time performance over the last five years. Finally, we compared on-time performance for each day in 2017 to the same day the previous year, and to the five year average, and used this trend-line to predict which days will be better or worse than their average on-time performance ratios might suggest. Travel dates were rated based on a combination of average on-time performance, improvements or declines over the last five years, and total flight volume, as a proxy for airport congestion and crowding
Airports and airlines were evaluated over the same interval, on a monthly basis, and then ranked according to their combined average on-time performance records. Flight volume was also calculated and a ranking established for both airports and airlines. However, there was only a slight correlation between flight volume and on-time performance, and thus these figures were not combined for an overall rating.
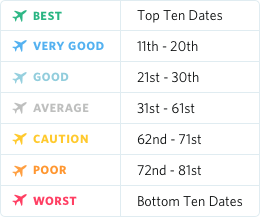
Indicators
Sources: U.S. DOT Bureau of Transportation Statistics: Airline On-Time Performance Statistics (March-May 2013-2017).