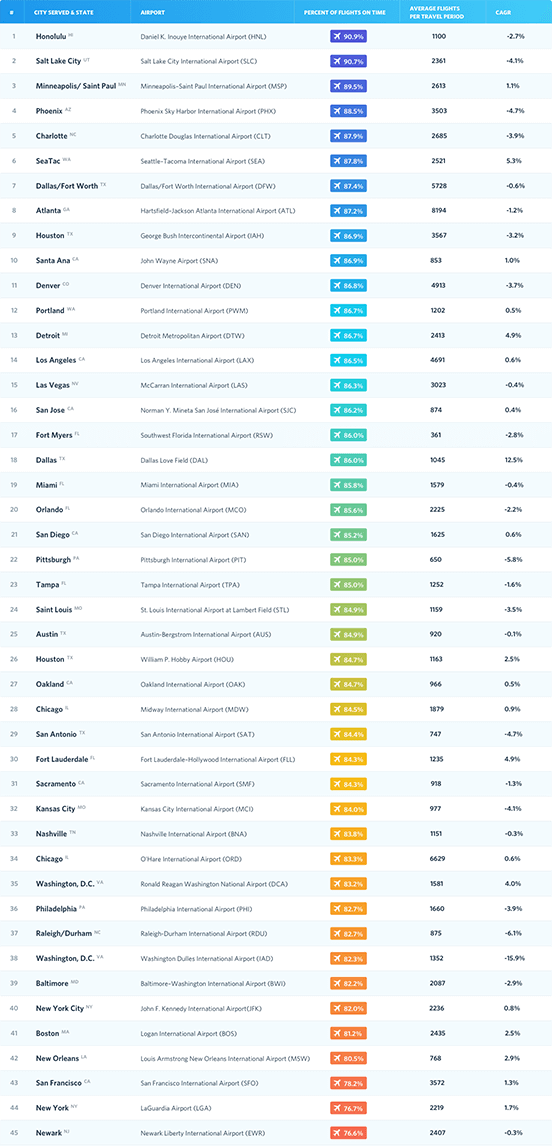
Full On-time Performance Ranking of the 45 Busiest Airports
RewardExpert examined historical data on the 45 busiest domestic airports to determine their overall on-time performance during peak travel dates for Labor Day that include the eight days surrounding the holiday.
Below is the full ranking of all 45 airports.
| # | Airport | City & State | Percent of Flights On Time | Average Flights During Travel Period Per Year | 5 Year CAGR* |
|---|---|---|---|---|---|
| 1 | Daniel K. Inouye HNL | Honolulu, HI | 90.9% |
1100 | -2.7% |
| 2 | Salt Lake City SLC | Salt Lake City, UT | 90.7% |
2361 | -4.1% |
| 3 | Minneapolis–Saint Paul MSP | Minneapolis/ Saint Paul, MN | 89.5% |
2613 | 1.1% |
| 4 | Sky Harbor PHX | Phoenix, AZ | 88.5% |
3503 | -4.7% |
| 5 | Charlotte Douglas CLT | Charlotte, NC | 87.9% |
2685 | -3.9% |
| 6 | Seattle–Tacoma SEA | SeaTac, WA | 87.8% |
2521 | 5.3% |
| 7 | Dallas/Fort Worth DFW | Dallas/Fort Worth, TX | 87.4% |
5728 | -0.6% |
| 8 | Hartsfield–Jackson ATL | Atlanta, GA | 87.2% |
8194 | -1.2% |
| 9 | George Bush IAH | Houston, TX | 86.9% |
3567 | -3.2% |
| 10 | John Wayne SNA | Santa Ana, CA | 86.9% |
853 | 1.0% |
| 11 | Denver International Airport DEN | Denver, CO | 86.8% |
4913 | -3.7% |
| 12 | Portland International Airport PWM | Portland, WA | 86.7% |
1202 | 0.5% |
| 13 | Detroit Metropolitan Airport DTW | Detriot, MI | 86.7% |
2413 | 4.9% |
| 14 | Los Angeles International Airport LAX | Los Angeles, CA | 86.5% |
4691 | 0.6% |
| 15 | McCarran LAS | Las Vegas, NV | 86.3% |
3023 | -0.4% |
| 16 | Norman Y. Mineta SJC | San Jose, CA | 86.2% |
874 | 0.4% |
| 17 | SouthwestRSW | Fort Myers, FL | 86.0% |
361 | -2.8% |
| 18 | Dallas Love Field DAL | Dallas, TX | 86.0% |
1045 | 12.5% |
| 19 | Miami International Airport MIA | Miami, FL | 85.8% |
1579 | -0.4% |
| 20 | Orlando International Airport MCO | Orlando, FL | 85.6% |
2225 | -2.2% |
| 21 | San Diego SAN | San Diego, CA | 85.2% |
1625 | 0.6% |
| 22 | Pittsburgh PIT | Pittsburgh, PA | 85.0% |
650 | -5.8% |
| 23 | Tampa International Airport TPA | Tampa, FL | 85.0% |
1252 | -1.6% |
| 24 | St. Louis STL | Saint Louis, MO | 84.9% |
1159 | -3.5% |
| 25 | Austin-Bergstrom AUS | Austin, TX | 84.9% |
920 | -0.1% |
| 26 | William P. Hobby HOU | Houston, TX | 84.7% |
1163 | 2.5% |
| 27 | Oakland International AirportOAK | Oakland, CA | 84.7% |
966 | 0.5% |
| 28 | Midway International Airport MDW | Chicago, IL | 84.5% |
1879 | 0.9% |
| 29 | San Antonio International Airport SAT | San Antonio, TX | 84.4% |
747 | -4.7% |
| 30 | Fort Lauderdale–Hollywood FLL | Fort Lauderdale, FL | 84.3% |
1235 | 4.9% |
| 31 | Sacramento SMF | Sacramento, CA | 84.3% |
918 | -1.3% |
| 32 | Kansas City MCI | Kansas City, MO | 84.0% |
977 | -4.1% |
| 33 | Nashville BNA | Nashville, TN | 83.8% |
1151 | -0.3% |
| 34 | O'Hare ORD | Chicago, IL | 83.3% |
6629 | 0.6% |
| 35 | Ronald Reagan DCA | Washington D.C., VA | 83.2% |
1581 | 4.0% |
| 36 | Philadelphia PHI | Philadelphia, PA | 82.7% |
1660 | -3.9% |
| 37 | Raleigh-Durham RDU | Raleigh/Durham, NC | 82.7% |
875 | -6.1% |
| 38 | Washington Dulles IAD | Washington D.C., VA | 82.3% |
1352 | -15.9% |
| 39 | Baltimore–Washington BWI | BAltimore, MD | 82.2% |
2087 | -2.9% |
| 40 | John F. Kennedy JFK | New York City, NY | 82.0% |
2236 | 0.8% |
| 41 | Logan BOS | Boston, MA | 81.2% |
2435 | 2.5% |
| 42 | Louis Armstrong MSW | New Orleans, LA | 80.5% |
768 | 2.9% |
| 43 | San Francisco SFO | San Francisco, CA | 78.2% |
3572 | 1.3% |
| 44 | LaGuardia LGA | New York, NY | 76.7% |
2219 | 1.7% |
| 45 | Newark Liberty EWR | Newark, NJ | 76.6% |
2407 | -1.3% |