Greenest Cities to Visit in 2017
It’s increasingly important to consider how green our choices are. Luckily, some cities make it easy to be green since they offer sustainable options to their visitors. Ecotourism is growing in popularity and that’s why RewardExpert set out to uncover the greenest major cities in the United States.
We compared 53 of the largest cities in the U.S. and evaluated them based on twenty key metrics across five categories: Ecotourism, Transportation, Lifestyle & Policy, Environment, and Energy. Using this data we determined a full ranking of the the greenest cities in the country.
TOP 5 Greenest Cities to Visit in 2017
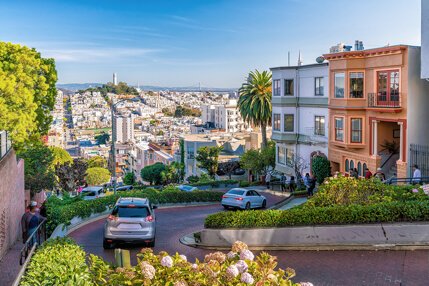
93.2San Francisco, CA
San Francisco, California comes in at number one on our list. San Fran ranked first for both ecotourism and transportation, and second for lifestyle & policy. Of all the cities we examined, San Francisco has the most hotels certified green by the U.S. Green Building Council (USGBC) per capita and 10.6% of its residents walk to work. Additionally, San Francisco has more farmers markets and community gardens per capita than any other city in the country. For travelers seeking to understand more about visiting an eco-conscious city, look no further than San Francisco.
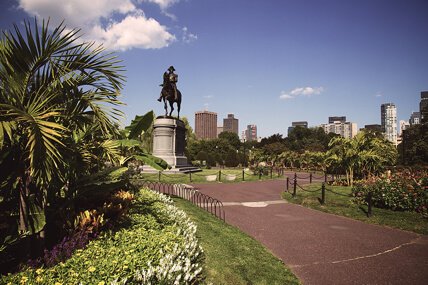
90.4Boston, MA
Boston, MA is the greenest city on the east coast and number two on our ranking. There’s no real need for a car in Boston, since it’s easy to bike, walk, or hop on the public transit system. About 14.8% of commuters walk to work, which is more than any other city we ranked. Last, but certainly not least, the American Council for an Energy Efficient Economy (ACEEE) named Boston the most energy-efficient city in the United States.

90.1Washington, D.C.
Washington, D.C. is the frontline for change as the capital of the United States. D.C. ranks first for both the number of available green jobs and the country’s best bike share program. Additionally, the ACEEE ranked Washington the third most energy-efficient city in the United States.

87.6Portland, OR
Portland, Oregon is full of eco-conscious people and comes in at number four on our list. Portland commuters drive to work less than any other city and 6.1% of residents bike to work, which is more than any other city. Portland has over 20 hotels certified green by the USGBC and 494 farmers markets, all of which make it an ideal destination for those looking to go green on their next vacation.

87.4Minneapolis, MN
Minneapolis is the most bike-friendly city in the U.S and comes in fifth on our list of green cities. About 14.0% of residents use public transportation to commute, which ranks third of all the cities we analyzed. Finally, it has the second best drinking water of all the cities we analyzed.
Best Cities for…
…Green Hotels
San Francisco comes in at number one for the city with the most green hotels per capita. According to RewardExpert data, San Francisco has 69 hotels certified green by the U.S. Green Building Council, which is more than any other city per capita.
…Farmers’ Markets
San Francisco tops the list with the most farmers markets per capita. According to RewardExpert data, San Francisco has 129 farmers markets per 10,000 residents. Also, three of San Fran’s farmers markets were listed on The Daily Meal’s annual list of the United States 101 Best Farmers Markets.
…Greenspace
No surprise here! Anchorage has significantly more greenspace than any other city in the United States. “Greenspace” means the acres of parkland compared to the acres of city area. Parkland includes city, county, metro, state, and federal parkland within city limits. Anchorage is comprised of 84.2% parkland, which is much more than Honolulu’s 33.0%, the city coming in at second-place.
…Public Transportation
Unsurprisingly, New York City comes in at number one on our list of cities with the best public transportation. Travelers can explore the whole city without ever needing to drive, as demonstrated by the 55.0% of New Yorkers who use public transportation to commute to work - far more than the 4.0% average nation-wide. Additionally, New York is also the most walkable city of all the cities we analyzed, making it easy for visitors to get around without relying on cars.
…Bike Share Programs
City-sponsored bike share programs have popped up all over the country. This effectively gives residents and visitors a greener alternative to driving and public transit. While bike sharing programs are growing in cities each month, Washington, D.C. currently has the most robust program. There are 463 bikes per 10,000 residents in their fleet, which gives anyone looking for a bike the opportunity to ride. Additionally, Washington, D.C. ranked seventh and second for bikeability and percentage of commuters who bike to work, respectively. Our nation’s capital is going green by being one of the most bike-friendly cities in the country.
Overall Ranking
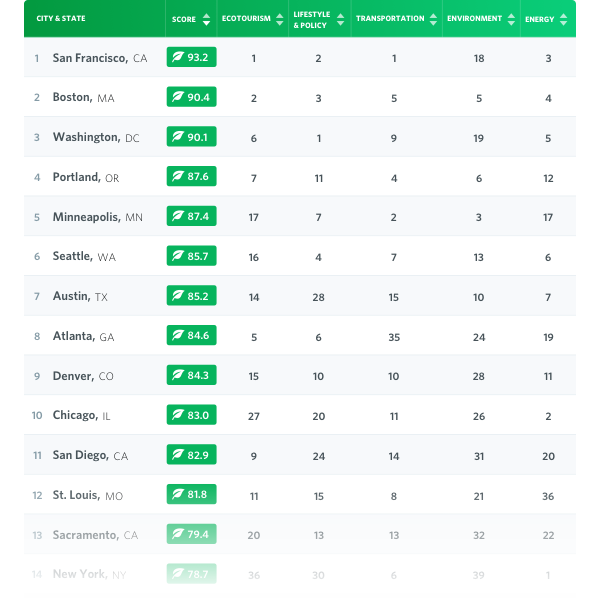
| # | City & State | Score | Ecotourism | Lifestyle & Policy | Transportation | Environment | Energy |
|---|---|---|---|---|---|---|---|
| 1 | San Francisco, CA | 93.2 |
1 | 2 | 1 | 18 | 3 |
| 2 | Boston, MA | 90.4 |
2 | 3 | 5 | 5 | 4 |
| 3 | Washington, D.C. | 90.1 |
6 | 1 | 9 | 19 | 5 |
| 4 | Portland, OR | 87.6 |
7 | 11 | 4 | 6 | 12 |
| 5 | Minneapolis, MN | 87.4 |
17 | 7 | 2 | 3 | 17 |
| 6 | Seattle, WA | 85.7 |
16 | 4 | 7 | 13 | 6 |
| 7 | Austin, TX | 85.2 |
14 | 28 | 15 | 10 | 7 |
| 8 | Atlanta, GA | 84.6 |
5 | 6 | 35 | 24 | 19 |
| 9 | Denver, CO | 84.3 |
15 | 10 | 10 | 28 | 11 |
| 10 | Chicago, IL | 83.0 |
27 | 20 | 11 | 26 | 2 |
| 11 | San Diego, CA | 82.9 |
9 | 24 | 14 | 31 | 20 |
| 12 | St. Louis, MO | 81.8 |
11 | 15 | 8 | 21 | 36 |
| 13 | Sacramento, CA | 79.4 |
20 | 13 | 13 | 32 | 22 |
| 14 | New York, NY | 78.7 |
36 | 30 | 6 | 39 | 1 |
| 15 | Tampa, FL | 78.4 |
3 | 8 | 39 | 20 | 38 |
| 16 | Miami, FL | 77.7 |
12 | 5 | 19 | 46 | 35 |
| 17 | Pittsburgh, PA | 77.7 |
21 | 19 | 17 | 33 | 24 |
| 18 | San Jose, CA | 76.9 |
38 | 9 | 18 | 40 | 14 |
| 19 | Philadelphia, PA | 76.5 |
31 | 32 | 3 | 43 | 10 |
| 20 | Kansas City, MO | 76.0 |
24 | 22 | 50 | 7 | 27 |
| 21 | Dallas, TX | 75.9 |
25 | 29 | 28 | 34 | 19 |
| 22 | Las Vegas, NV | 75.8 |
4 | 31 | 27 | 52 | 26 |
| 23 | Milwaukee, WI | 75.6 |
41 | 14 | 25 | 23 | 23 |
| 24 | Houston, TX | 75.4 |
33 | 37 | 20 | 42 | 9 |
| 25 | Los Angeles, CA | 75.4 |
34 | 23 | 26 | 51 | 8 |
| 26 | Baltimore, MD | 75.2 |
45 | 12 | 12 | 49 | 15 |
| 27 | Columbus, OH | 74.6 |
50 | 27 | 24 | 9 | 21 |
| 28 | Albuquerque, NM | 74.1 |
22 | 50 | 23 | 2 | 41 |
| 29 | Tucson, AZ | 73.2 |
13 | 41 | 16 | 25 | 44 |
| 30 | Honolulu, HI | 73.2 |
18 | 21 | 32 | 22 | 50 |
| 31 | Anchorage, AK | 73.2 |
26 | 49 | 21 | 1 | 53 |
| 32 | Cleveland, OH | 72.3 |
35 | 16 | 31 | 38 | 28 |
| 33 | Charlotte, NC | 71.8 |
28 | 34 | 49 | 12 | 25 |
| 34 | Nashville, TN | 71.3 |
32 | 25 | 40 | 17 | 31 |
| 35 | Raleigh, NC | 70.5 |
23 | 18 | 53 | 8 | 42 |
| 36 | New Orleans, LA | 70.4 |
10 | 33 | 33 | 37 | 43 |
| 37 | Phoenix, AZ | 70.2 |
37 | 36 | 29 | 48 | 16 |
| 38 | Virginia Beach, VA | 69.6 |
8 | 43 | 43 | 29 | 39 |
| 39 | Indianapolis, IN | 68.9 |
19 | 26 | 52 | 44 | 32 |
| 40 | San Antonio, TX | 68.4 |
40 | 46 | 38 | 36 | 13 |
| 41 | Colorado Springs, CO | 68.0 |
29 | 39 | 34 | 11 | 47 |
| 42 | Omaha, NE | 66.7 |
30 | 44 | 41 | 14 | 46 |
| 43 | Detroit,MI | 66.2 |
49 | 17 | 42 | 35 | 37 |
| 44 | El Paso, TX | 65.5 |
51 | 53 | 48 | 4 | 29 |
| 45 | Oklahoma City, OK | 63.3 |
43 | 38 | 47 | 16 | 40 |
| 46 | Lexington, KY | 63.2 |
44 | 45 | 30 | 15 | 52 |
| 47 | Louisville, KY | 62.2 |
42 | 35 | 46 | 45 | 34 |
| 48 | Jacksonville, FL | 57.6 |
46 | 47 | 51 | 27 | 30 |
| 49 | Memphis, TN | 56.5 |
48 | 48 | 36 | 47 | 33 |
| 50 | Wichita, KS | 56.4 |
39 | 51 | 44 | 30 | 49 |
| 51 | Fresno, CA | 55.9 |
47 | 42 | 22 | 53 | 45 |
| 52 | Tulsa, OK | 51.5 |
52 | 40 | 45 | 41 | 48 |
| 53 | Corpus Christi, TX | 51.3 |
53 | 52 | 37 | 50 | 51 |
Expert Insights

Rhiannon Jacobsen
Methodology
To help travelers discover which U.S. cities are the greenest to visit in 2017, RewardExpert analysts compared U.S. cities with more than 300,000 residents across five key dimensions: Ecotourism, Transportation, Lifestyle & Policy, Environment, and Energy.
We first identified 20 relevant metrics, which are listed below in their respective dimensions and with their corresponding weights. Each metric was given a value between 0 and 100, wherein 100 represents the most favorable conditions for travel and 0 the least.
Finally, we calculated the overall score for each city using the weighted average across all metrics and ranked the cities accordingly.
Indicators
Ecotourism — 20 Points
- Number of "green" hotels per capita: Full Weight (10.0 Points)
Transportation — 20 Points
- Walkability: Full Weight (2.2 Points)
- Transit Score: Full Weight (2.2 Points)
- Bikeability: Full Weight (2.2 Points)
- Average Commute Time: Full Weight (2.2 Points)
- % of residents who drive: Full Weight (2.2 Points)
- % of residents who carpool: Full Weight (2.2 Points)
- % of residents who use public transit: Full Weight (2.2 Points)
- % of residents who bike: Full Weight (2.2 Points)
- % of residents who walk: Full Weight (2.2 Points)
Environment — 20 Points
- Air-Quality Index: Full Weight (5.0 Points)
- Drinking Water Quality: Full Weight (5.0 Points)
- Green Space: Full Weight (5.0 Points)
- Water Quality: Full Weight (5.0 Points)
Energy Sources — 20 Points
- ACEEE Energy Ranking: Full Weight & a Half (15.0 Points)
- Solar Photovoltaic (PV) Installations per Capita: Half Weight (5.0 Points)
Lifestyle & Policy — 20 Points
- Number of Farmers Markets per Capita: Full Weight (5.0 Points)
- Community Garden Plots per Capita: Full Weight (5.0 Points)
- “Green” Job Opportunities: Full Weight (5.0 Points)
- Number of Bicycles per capita provided by City Bike Share Program: Full Weight (5.0 Points)
Sources: Data used to create these rankings were collected from the U.S. Census Bureau, the Bureau of Labor Statistics, U.S. Energy Information Administration, Environment America, American Council for an Energy-Efficient Economy, The Trust for Public Land, Walk Score, Alliance for Biking & Walking, Numbeo, Indeed, TripAdvisor, and Yelp.