2017's Best Destinations to Explore by Bike
For tourists, biking is not only an economical and efficient mode of transportation, but also a great way to explore the nooks and crannies of a new city. There’s no need for a driver’s license — with just a helmet, bikers can see a city like its locals do. They can fly through neighborhoods, see subtle changes in the architecture, and discover restaurants and bars that might not be found in a travel guide. However, certain cities are more bike-friendly than others. That’s why RewardExpert examined the country’s cities to determine which destinations are the best to explore by bike.
We compared 53 of the largest cities in the country and evaluated them on 13 key metrics across four categories: biking infrastructure, city profile, bike-share index, and biking safety. Using this data we determined a full ranking of the the most bike-friendly cities in the country.
Top 10 Cities to Explore by Bike

94.9Minneapolis, MN
Minneapolis is number one on our list for best U.S. cities for biking. The city has 170 bike share stations and 130 miles of bike lanes.The program is called Nice Ride MN. If that’s not enough, the city has almost 180 miles of paved paths for biking or walking. According to the Bike & Walk Alliance, 4.0% of commuters bike to work, which ranks second of all the cities we examined. Minneapolis is built for exploring by bike.

93.9Boston, MA
Boston ranks second on our list. Boston has a long-standing history of being a great city for bicyclists. With 4.1 bike lanes per square mile, it has the second most bike lanes of all the cities we analyzed. It also has a very well-used bike share program. According to our data, Boston also ranks second when it comes to the number of bikes in their bike-share program per capita. Boston’s bike-share program is called The Hubway. Lastly, Boston ties with D.C. for first place when it comes to safety. There are very low accident rates and this is primarily due to the city’s efforts to create bike lanes.

93.3Chicago, IL
Chicago ranks third on our list of the country’s best biking cities. The Windy City has 2.1 miles of bike lanes per square mile. The city is extremely well connected by bike paths. There are 161 miles of protected bike lanes in addition to 280 miles of unprotected lanes. Furthermore, the city’s public bike share program, Divvy Bikes, has 300 stations, all of which make Chicago an ideal city to bike through while on vacation.

93.3New York, NY
The Big Apple is fourth on our list; it’s never been better for bikers in New York. NYC’s recent installation of the Citi-Bike program added thousands of more riders to the streets. In New York alone, there are 400 miles of bike lanes. There are 72 bikes per 10,000 commuters in Citi-Bike’s fleet. Who needs the subway, let alone a car, when it’s so easy to bike!

91.8Washington, D.C.
Washington D.C. has the most extensive bike-share program in the country, and that’s why it’s no surprise the nation’s capital ranks fifth on our list of all cities. Capital Bikeshare, Washington’s bike share program has 347 stations throughout the city and 463 bikes per 10,000 commuters in the fleet. Washington also ties for first when it comes to safety. The city averages only 1.6 fatalities per 10,000 commuters annually.

90.6Portland, OR
Portland is an awesome city for biking. It’s part of the culture. The city breaths biking, indicated by percentage of commuters who bike to work. Portland ranks first in this category. Furthermore, the number of commuters who bike to work grows every year. Portland has seen a year-over-year change of 2.3% in this category in the last five years, which is significantly greater than any other city. The remarkable thing about Portland is that they’ve been a great biking town for a long time, so the fact they’re still seeing that type of gain in bikers is amazing.

90.5Seattle, WA
For its improvements in safety and biking infrastructure, Seattle is 7th on our list. Seattle ranks fourth overall in regard to fewest biker and pedestrian per capita fatalities. Furthermore, it has grown during the last five years in this category more than any other city. Seattle has 48 miles of paved biking paths through nature parks, which means there are ample opportunities for visitors to ride while traveling.

90.2San Diego, CA
San Diego comes in eighth overall and first California city in our ranking. San Diego has 99 miles of protected bike lanes, which is second only to Chicago. The protected bike lanes make the city significantly safer and this leads to more bikers. Those traveling to San Diego will have a blast riding through not only San Diego’s parks and nature preserves, but beachside as well. Also, the beautiful weather all year round won’t hurt either! San Diego’s bike-share program is called Deco Bike.

89.3Columbus, OH
Columbus ranks 9th on our list due to the significant strides the city has made to become more bike friendly. Over the last years, the bike lanes per square mile in Columbus increased over 13.0% year-over-year. CoGo, the city’s public bike-share program, has helped enormously in making the city more bike-friendly. Overall, Columbus is safer to bike and given the recent changes, there’s no reason to think it won’t continue in the future.

89.2Denver, CO
Last on our list of the top ten is Denver. Denver is historically a very bike-friendly city. It scored well across all our dimensions. The city has 267 miles of paved biking paths, which ranks third of all the cities we analyzed. Furthermore, Denver’s B-cycle has many stations and bikes in its fleet. Denver ranked fourth in regard to number of bike share stations per capita. Travelers should have no problem biking through the city. Don’t forget a helmet though! They don’t call it the Rocky Mountain State for nothing.
Special Recognition
Most Improved Cities
This list reflects cities that have implemented significant changes in biking infrastructure over the last five years.
Indianapolis grew in commuters who ride to work and number of bike lanes per square mile. The city really stood out in the latter; Indianapolis grew over 18% year over year in the number of bike lanes per square mile.
Las Vegas added a good number of bike lanes in the last five years. There are currently 3.6 per square mile, while four years ago there were just 1.2.
We spoke of Columbus’s laurels earlier, but we just can’t reiterate enough how bike-friendly Columbus is becoming. A relatively fast increase in number of bike lanes and less biking accidents have helped Columbus become more bike-friendly.
Los Angeles still has a ways to go to be really bike-friendly, however we have to give them credit for improving. The city has added a large number of bike lanes in the last five years with a 22.0% year-over-year change.
Nashville is another city implementing more bike lanes. The city’s government has rolled out more protected and unprotected lanes for bikers, which is why it’s fifth on our list of the most improved cities.
Up & Coming Cities
This list reflects cities that have significantly improved in the last three years AND either have implemented a citywide bike-share program in the last six months or have a bike-share program being implemented soon.
Keep an eye out on the Home of the Blues! Memphis plans to implement a bike-share program in 2017. To gear up for the program, the city has already expanded its bike lanes. Once Memphis fully and successfully implements its bike-share program, the city will become much more bike-friendly.
Colorado Springs is looking to buff up on biking. Plans for a bike-share program in Colorado Springs have been in the works for a year now, and the city has recently created more designated bike lanes. Now there are 1.6 bike lanes per square mile.
Bikers in Jacksonville are happy to know that their legislators have added more bike lanes over the last few years. Jacksonville is implementing their first batch of bike-share kiosks next month!
El Paso is coming up hot! The city added 7.5% more bike lanes per square mile over the last five years. Their bike-share program is just under two years old and added seven new stations last fall.
Baltimore? How about you start to Bike-a-more! Baltimore’s bike-share program was implemented last fall. Currently there are 1.1 bike lanes per square mile.
Overall Ranking
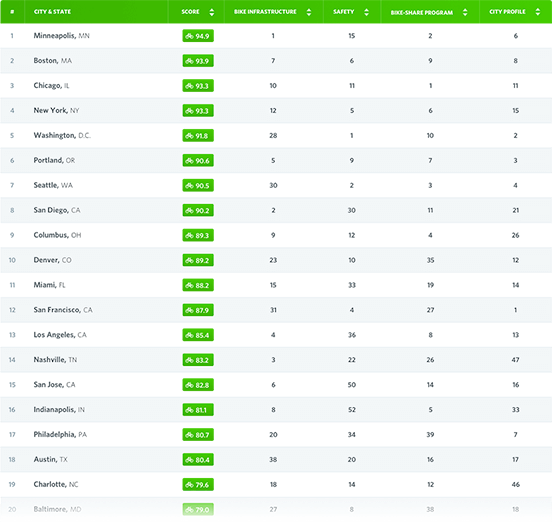
| # | City & State | Score | Bike Infrastructure | Safety | Bike-Share Program | City Profile |
|---|---|---|---|---|---|---|
| 1 | Minneapolis, MN | 94.9 |
1 | 15 | 2 | 6 |
| 2 | Boston, MA | 93.9 |
7 | 6 | 9 | 8 |
| 3 | Chicago, IL | 93.3 |
10 | 11 | 1 | 11 |
| 4 | New York, NY | 93.3 |
12 | 5 | 6 | 15 |
| 5 | Washington, D.C. | 91.8 |
28 | 1 | 10 | 2 |
| 6 | Portland, OR | 90.6 |
5 | 9 | 7 | 3 |
| 7 | Seattle, WA | 90.5 |
30 | 2 | 3 | 4 |
| 8 | San Diego, CA | 90.2 |
2 | 30 | 11 | 21 |
| 9 | Columbus, OH | 89.3 |
9 | 12 | 4 | 26 |
| 10 | Denver, CO | 89.2 |
23 | 10 | 35 | 12 |
| 11 | Miami, FL | 88.2 |
15 | 33 | 19 | 14 |
| 12 | San Francisco, CA | 87.9 |
31 | 4 | 27 | 1 |
| 13 | Los Angeles, CA | 85.4 |
4 | 36 | 8 | 13 |
| 14 | Nashville, TN | 83.2 |
3 | 22 | 26 | 47 |
| 15 | San Jose, CA | 82.8 |
6 | 50 | 14 | 16 |
| 16 | Indianapolis, IN | 81.1 |
8 | 52 | 5 | 33 |
| 17 | Philadelphia, PA | 80.7 |
20 | 34 | 39 | 7 |
| 18 | Austin, TX | 80.4 |
38 | 20 | 16 | 17 |
| 19 | Charlotte, NC | 79.6 |
18 | 14 | 12 | 46 |
| 20 | Baltimore, MD | 79.0 |
27 | 8 | 38 | 18 |
| 21 | Milwaukee, WI | 77.8 |
21 | 41 | 49 | 28 |
| 22 | Las Vegas, NV | 77.5 |
11 | 26 | 41 | 43 |
| 23 | Cleveland, OH | 77.5 |
29 | 7 | 47 | 41 |
| 24 | Memphis, TN | 76.5 |
13 | 43 | 18 | 34 |
| 25 | Omaha, NE | 76.4 |
19 | 24 | 34 | 52 |
| 26 | Atlanta, GA | 76.0 |
16 | 38 | 25 | 23 |
| 27 | Colorado Springs, CO | 75.1 |
14 | 31 | 17 | 39 |
| 28 | San Antonio, TX | 75.0 |
22 | 49 | 42 | 40 |
| 29 | Pittsburgh, PA | 74.9 |
32 | 13 | 13 | 20 |
| 30 | St. Louis, MO | 74.7 |
24 | 18 | 53 | 25 |
| 31 | Jacksonville, FL | 74.5 |
17 | 51 | 22 | 38 |
| 32 | Anchorage, AK | 74.4 |
39 | 17 | 36 | 37 |
| 33 | Tucson, AZ | 74.2 |
35 | 44 | 44 | 10 |
| 34 | Albuquerque, NM | 74.0 |
33 | 39 | 28 | 19 |
| 35 | Sacramento, CA | 73.8 |
37 | 46 | 51 | 9 |
| 36 | Honolulu, HI | 73.6 |
36 | 19 | 24 | 27 |
| 37 | New Orleans, LA | 73.5 |
47 | 23 | 21 | 5 |
| 38 | Fresno, CA | 73.1 |
25 | 53 | 30 | 22 |
| 39 | Virginia Beach, VA | 72.5 |
50 | 3 | 43 | 31 |
| 40 | Oklahoma City, OK | 72.4 |
34 | 40 | 33 | 51 |
| 41 | Houston, TX | 71.3 |
48 | 37 | 29 | 24 |
| 42 | Phoenix, AZ | 71.0 |
41 | 45 | 40 | 29 |
| 43 | Louisville, KY | 70.5 |
40 | 21 | 37 | 44 |
| 44 | El Paso, TX | 68.7 |
26 | 32 | 45 | 53 |
| 45 | Wichita, KS | 68.7 |
42 | 16 | 15 | 42 |
| 46 | Raleigh, NC | 67.5 |
44 | 28 | 20 | 32 |
| 47 | Kansas City, MO | 65.7 |
51 | 47 | 23 | 35 |
| 48 | Tampa, FL | 65.5 |
46 | 25 | 32 | 36 |
| 49 | Dallas, TX | 64.1 |
45 | 42 | 46 | 48 |
| 50 | Corpus Christi, TX | 63.5 |
43 | 27 | 31 | 50 |
| 51 | Detroit, MI | 61.6 |
53 | 35 | 48 | 30 |
| 52 | Tulsa, OK | 59.8 |
52 | 48 | 50 | 45 |
| 53 | Lexington, KY | 57.0 |
49 | 29 | 52 | 49 |
Expert Insights

Derrick Ko
Methodology
To help traveler discover which U.S. cities are best to explore by bike in 2017, RewardExpert compared U.S. cities with more than 300,000 residents across four key dimensions: 1) City Profile, 2) Bike Safety, 3) Biking Infrastructure, and 4) Bike-Share Programs.
We first identified 13 relevant metrics that are listed below in their respective dimensions and with their corresponding weights. Each metric was given a value between 0 and 100, wherein 100 represents the most favorable conditions for travel and 0 the least.
Finally, we calculated the overall score for each city using the weighted average across all metrics and ranked the cities accordingly.
Indicators
City Profile - 20 Points
- Bikeability: Full Weight (5.0%)
- Number of Pleasant Days Per Year: Half Weight (2.5%)
- Percent of Commuters who Bike: Half Weight (2.5%)
- Annualized Change of Commuters Who Bike To Work: Double Weight (10.0%)
Biking Infrastructure - 40 Points
- Miles of Protected Bike Lanes: Weight 10.0%
- Miles of Unprotected Bike Lanes: Weight 5.0%
- Miles of Paved Biking Paths: Full Weight 3.0%
- Miles of Bike Lanes per Square Mile: Weight 2.0%
- Annualized Change of Bike Lanes per Square Mile: Weight 20.0%
Biking Share Index - 25 Points
- Number of Bikes in Program Fleet per capita: Full Weight (12.5%)
- Number of Bike Stations per capita: Full Weight (12.5%)
Biking Safety - 15 Points
- Pedestrian/Biker fatalities per 10,000 commuters: Weight 5.0%
- Annualized Change of pedestrian/Biker Fatalities per 10,000 commuters: Weight 10.0%
Sources: Data used to create these rankings were collected from the U.S. Census Bureau, the Bureau of Labor Statistics, the Bike & Walk Alliance, Yelp, Numbeo, Walk Score, and Kelly Norton.